
Looking for help?
JTAG Debugging Setup
Windows Tools
- Eclipse Embedded CDT like:eclipse-embedcpp-2023-09-R-win32-x86_64.zip
- gcc-arm-none-eabi like:gcc-arm-none-eabi-10.3-2021.10-win32.exe
- Jlink driver like:JLink_Windows_x86_64_V752.exe (Depends on your JLink tools on hand)
Debugging Procedure
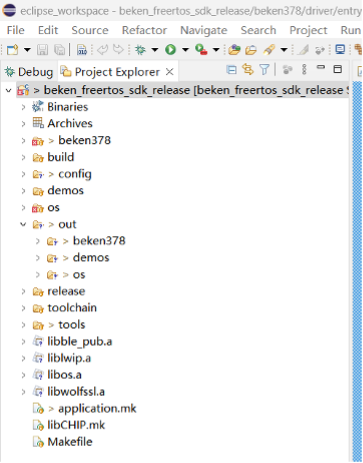
- The project to be debugged imports eclipse (Optional):
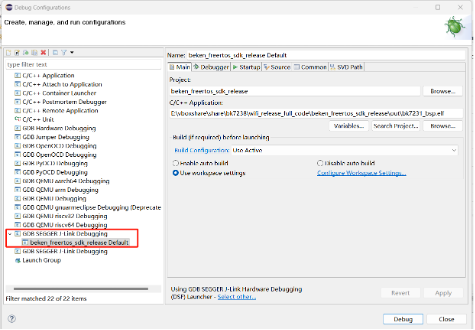
- Click Run on the menu bar -> Debug Configurations…-> double click GDB SEGGER J-Link Debugging,New debug entry will be created:
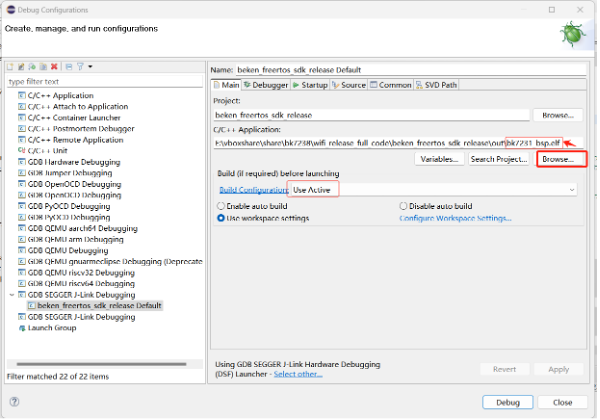
- Configure the “Main” page of the new Debug entry:
- Click the button of “Browse…” and then select the file of “.elf” which will be debugged.
- Select “Use Active” as the “Build Configuration “
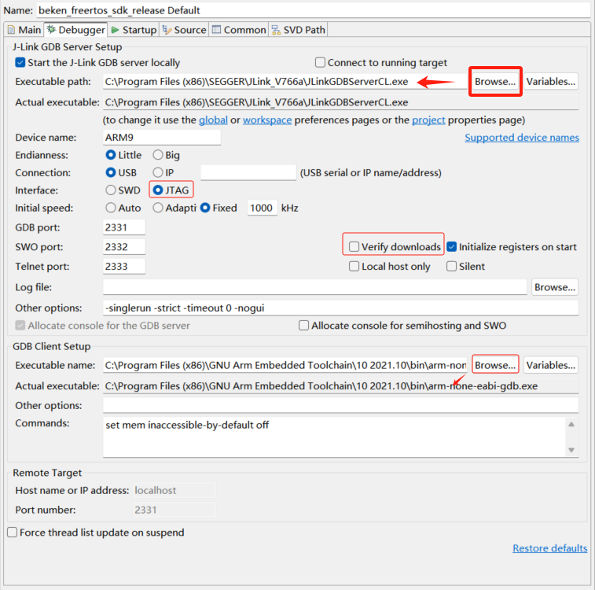
- Configure the “Debugger” page:
- Click the top button of “Browse…” to select the “JLinkGDBServerCL.exe”
- Set “Device name” as “ARM9”
- Select “JTAG” as the “Interface”
- Deselect the “Verify downloads.”
- Click the bottom button of “Browse…” to select the “arm-none-eabi-gdb.exe”
- Configure the “Startup” page:
- Set “Set program counter at (hex)” to 0
- Set a breakpoint at “entry_main”

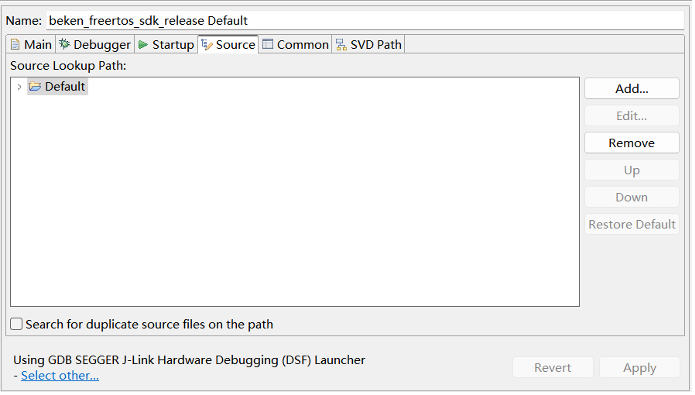
- The “Source” page uses the default configuration:
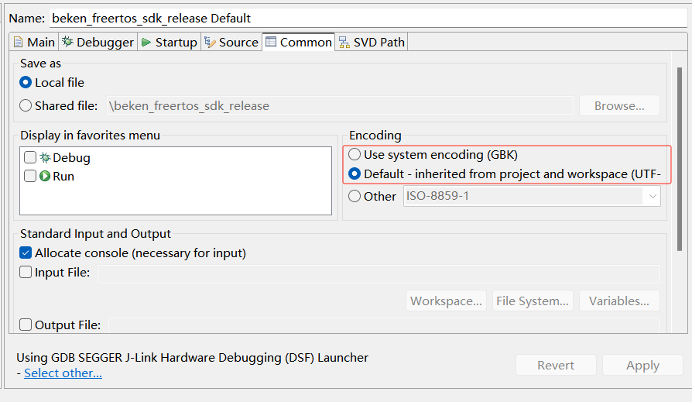
- The “Common” page uses the default configuration:
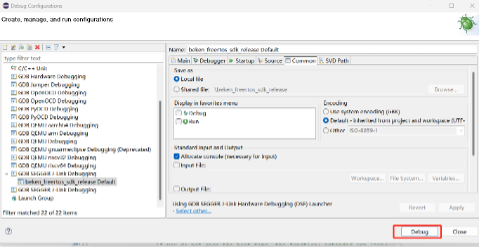
- Click the “Debug” button to enter the Debug mode:
The following interface is displayed after the startup:
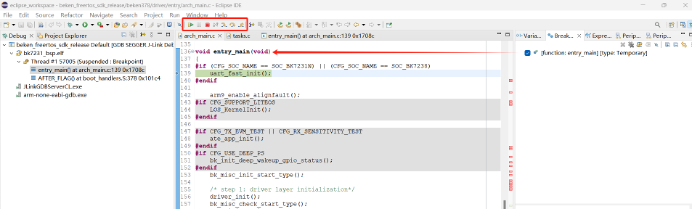
- Using button like “Step Into”、”Step Over”、”Step Return” to do the debug